HEXAGON-IMAGING-PAM

Version:

Product
New

Large-Area Chlorophyll Fluorescence Imaging

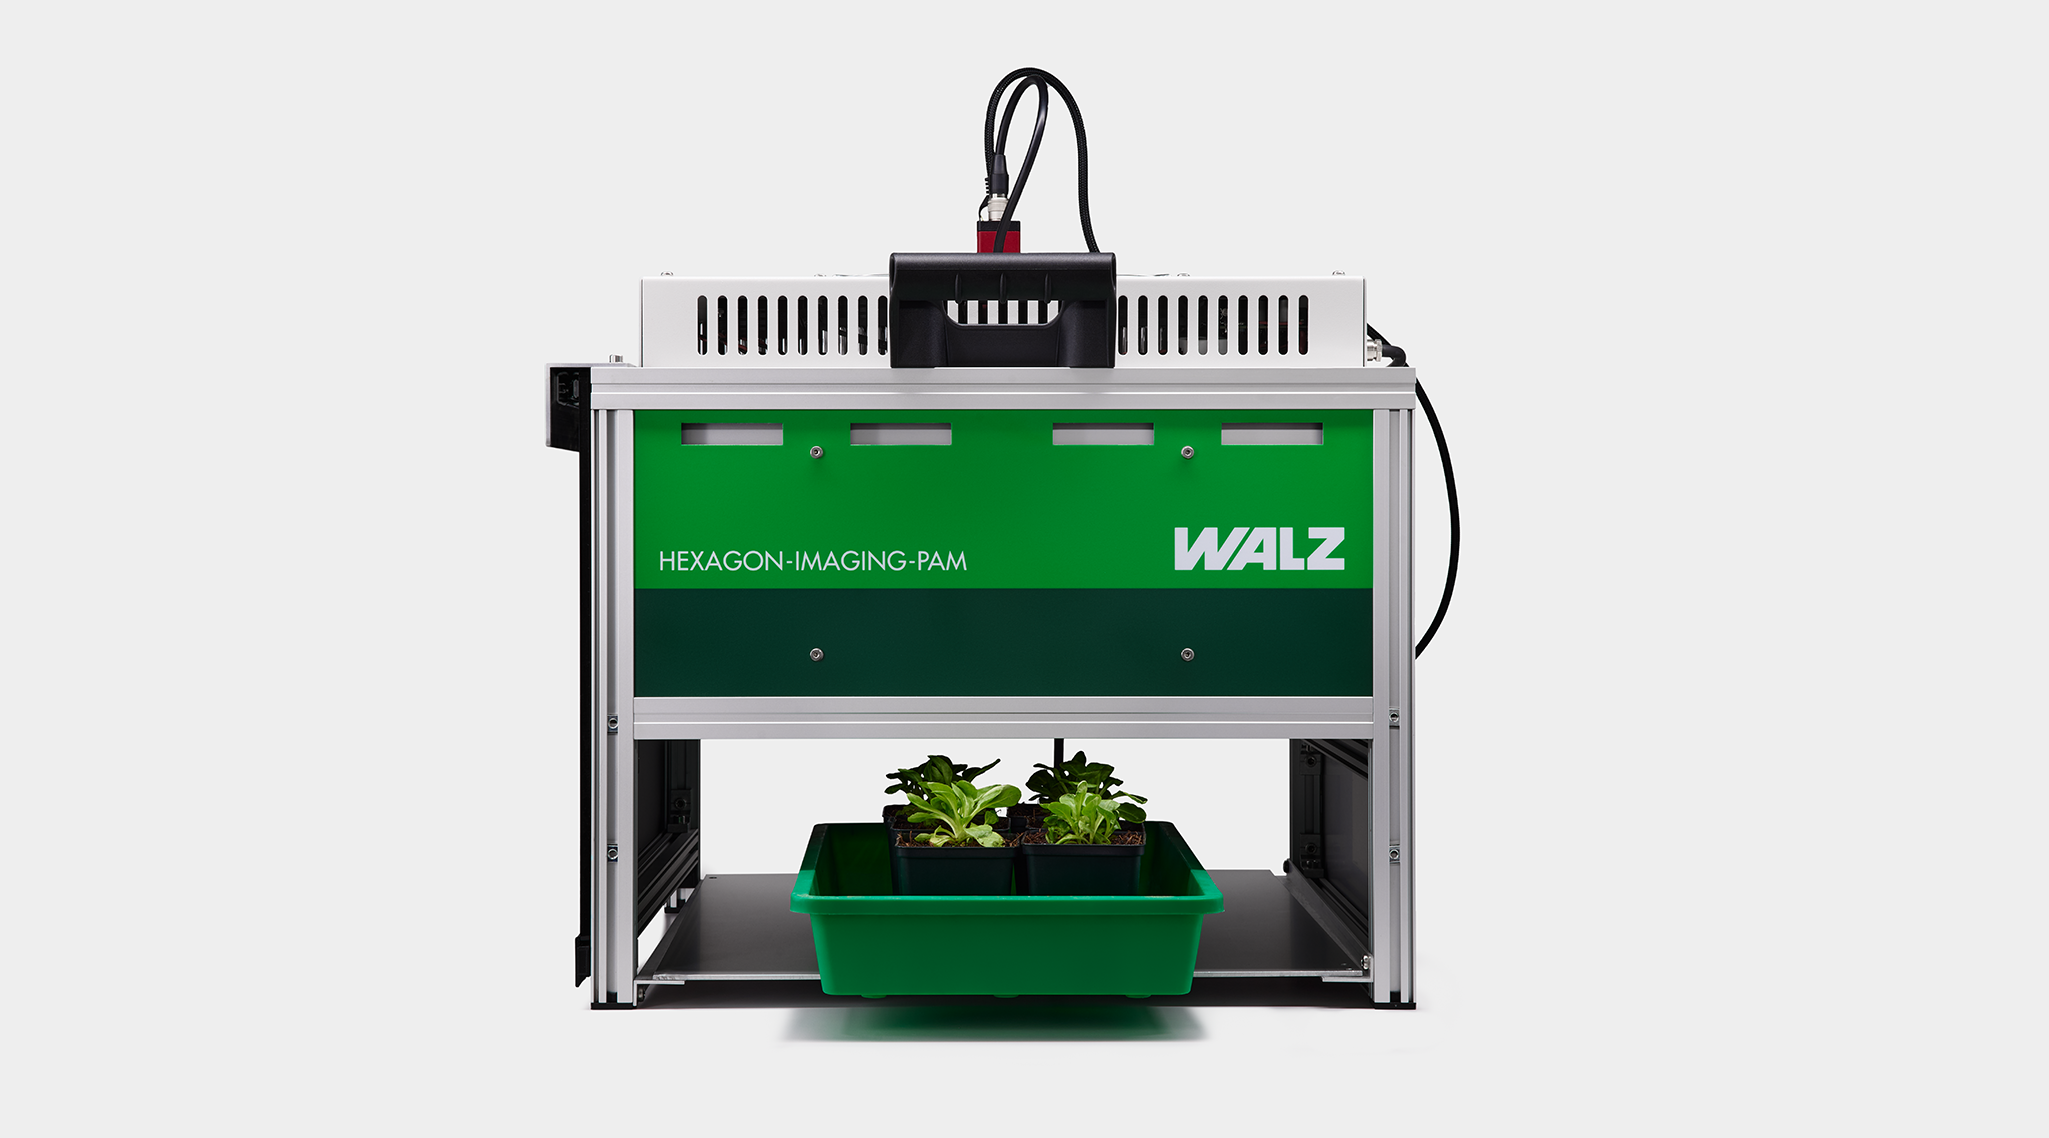
The HEXAGON-IMAGING-PAM represents the largest Walz Imaging System available. Despite the large measuring area, the instrument is still flexible enough to measure a wide variety of samples. These include individually potted plants, seedlings in larger plant trays, or harvested samples of higher or lower plants.
It can measure areas of 20 x 24 cm with a resolution of up to 1000 x 1200 px (2x2 binning), according to the PAM principle with highest accuracy.
In contrast to the significantly smaller MAXI Imaging System, the HEXAGON-IMAGING-PAM offers 4 times the measuring area of the smaller MAXI-IMAGING-PAM and up to 1.2 MP image resolution (binning switched off).

This high resolution results in a pixel size of 100 x 100 µm.
During the design process, we placed special emphasis on the shadow-free, uniform illumination of the measuring area and designed the cooling of the panels very efficiently for a long service life of the LEDs.

The HEXAGON-IMAGING-PAM can now also be used to determine the Fo' value of the samples under investigation. For this purpose, the instrument has an additional, dual-circuit far-red LED panel with which FR light and also FR light with a higher red component can be very finely dosed.
The name HEXAGON-IMAGING-PAM is derived from the shape of the individual panels that make up the main panel. The chosen shape offers the best possibility to achieve the ideal illumination of the sample area. Smaller hexagon shaped panel sub-units allow better compensation of LED imbalances to achieve even more reproducible results.
In the HEXAGON-IMAGING-PAM, the control electronics are integrated into the measuring head so that, despite the large measuring surface, a quite compact device is available.


Chlorophyll Fluorescence and PAM Fluorometry

Chlorophyll fluorescence is a very sensitive indicator of photosynthesis. Quantitative information on the quantum yield of photosynthetic energy conversion is obtained by PAM fluorometry and the saturation pulse method (Schreiber U (2004) Pulse-Amplitude-Modulation (PAM) Fluorometry and Saturation Pulse Method: An Overview, pp. 279-319. Kluwer Academic Publishers, Dordrecht, The Netherlands).
A wide range of photosynthetic parameters can be derived from fluorescence measurements, giving insight into the physiological state of all photosynthetically active organisms, including higher plants, mosses and ferns as well as various types of algae, phytoplankton and biofilms.


Chlorophyll Fluorescence Imaging

With the advance of highly sensitive CCD cameras, followed by modern CMOS type camera chips, together with extremely strong light emitting diodes (LED), development of IMAGING-PAM fluorometers has become possible that not only measure images of chlorophyll fluorescence but are also fully competent in providing all relevant chlorophyll fluorescence parameters, using the saturation pulse method. In this way, images of photosynthetic activity and its spatio-temporal variations can be obtained.
In recent years, the trend has increasingly been towards very low-noise CMOS cameras offering high sensitivities. LED technology is also making continuous progress so that high irradiation intensities can be achieved with lower power.

An often-neglected problem of LEDs is their heating, which leads to a change in their performance. With the new HEXAGON-IMAGING-PAM, we have therefore focused in particular on compensating for these power changes and thus opening up new dimensions of measurement accuracy in imaging and illumination homogeneity. This also opens the door for new measurement methods to be integrated into the software.

All IMAGING-PAM fluorometers provide images for 17 different parameters. The fluorescence parameter Ft is continuously monitored and kinetic values can also be exported with 150 ms clock speed. Fo and Fm are assessed after dark adaptation, serving as reference for fluorescence quenching analysis by the saturation pulse method.

Besides Fv/Fm, the PS II quantum yield after dark acclimation, also the PS II quantum yield during illumination, Y(II), and the quantum yields of regulated and non-regulated energy dissipation, Y(NPQ), Y(NO) as well as the apparent electron transport rate (ETR) can be imaged.

General Features HEXAGON-IMAGING-PAM

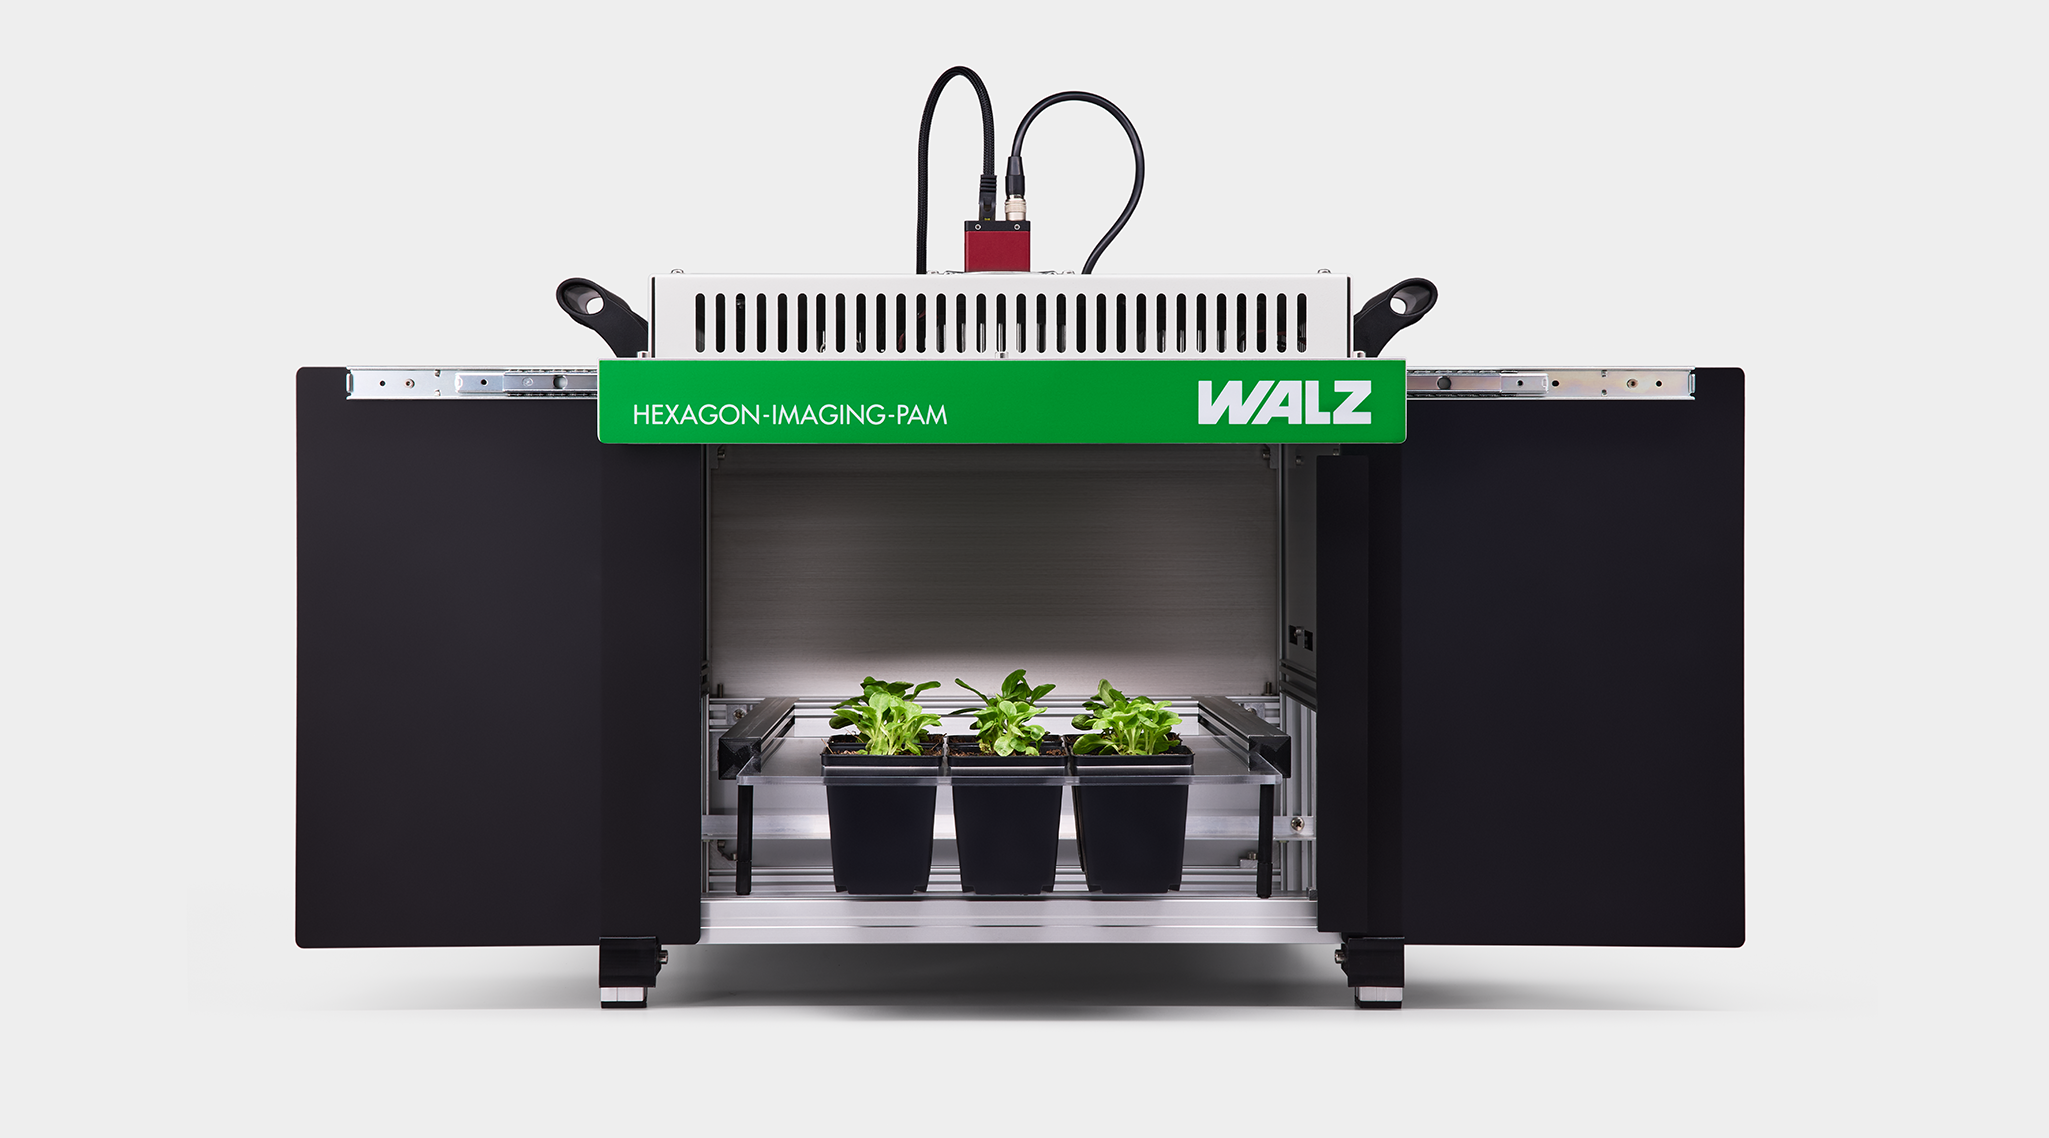
In the development of the HEXAGON-IMAGING-PAM, we have followed the wishes of our customers and have, in addition to an enlarged surface, also revised the LED control to create space in the technical specifications for new applications. The housing was also adapted to the versatile applications of our customers and allows the measurement of leaves, algae in vessels and benthic organisms but also whole, potted plants or plant trays without long conversion times.
Safety has also been taken into consideration. The strong light pulses with which PAM instruments work should not harm the eyes of the experimenter. Therefore, we have integrated a safety shutdown into the HEXAGON-IMAGING-PAM, which suppresses all strong light intensities if the door is opened during an experiment.
After starting the software, the HEXAGON-IMAGING-PAM works in 2x2 pixel binning mode on an area of 20 x 24 cm. However, a special zoom function allows the user to zoom to a freely selectable quarter of the measuring area without changing the image resolution. Thus, without loss of sensitivity, it is very easy to work with a higher magnification on a smaller measuring area.

Learn more about the HEXAGON-IMAGING-PAM

Scientific Publications using Walz Devices

Source: Google Scholar.
Keywords: (Walz OR Waltz) Effeltrich.
Date: June 22, 2026.

Ʃ = 19642

Per Year

Source: Google Scholar.
Keywords: (Walz OR Waltz) Effeltrich.
Date: June 22, 2026.

Ʃ = 19642

Year

Selected Publications

The pastidial alpha-glucan phosphorylase modulates maltodextrin metabolism and affects starch parameters in Arabidopsis thaliana

Singh A, Rajendran R, Schöttler MA, Li X, Liu Q, Muntaha SN, Fettke J

Journal of Experimental Botany 76: 2222-2238

Go to publication

Role of chloroplast lipid-remodelling protein 23 during cold acclimation in Arabidopsis thaliana

Lo WT, Winkler D, Münch M, Lehmann M, Steiner K, Bölter B, Tullberg C, Grey C, Kleine T, Abdel-Salam E, Ebel KW, Neuhaus HE, Büyüktaș D, de Vries S, Kunz H-H, Leister D, Schwenkert S

Physiological insights into the responses of tea plants to aluminum through an integrated transcriptomic and metabolomic analysis

Zhang X, Luo S, Ye X, Liu L, Jia X, Jiang D, Wen W

Horticulture Advances 3: 21

Go to publication

Regulation of jasmonic acid signalling in tomato stress: insights into the MYB15-LOXD and MYB15-MYC2-LOXD regulatory modules

Li W, Wen Y, Quan J, Gao M, Shang C, Liu X, Liu G, Hu X, Li J

Plant Biotechnology Journal 23: 4246-4260

Go to publication

Engineering saline-alkali-tolerant apple rootstock by knocking down MdGH3 genes in M9-T337

Zhi F, Fan T, Li J, Zhang S, Qian Q, Khalil A, Niu C, Wang K, Ma F, Li X, Guan Q

Stress Biology 5: 44

Go to publication

Targeted translation inhibition of chloroplast and mitochondrial mRNAs by designer pentatricopeptide repeat proteins

Manavski N, Schwenkert S, Kunz H-H, Leister D, Meurer J

Nucleic Acids Research 53: gkaf222

Go to publication

Differential impact of copper stress in two Ectocarpales: metabolic disruption and defensive signaling in the free-living Ectocarpus sp7 and the endophytic Laminarionema elsbetiae

Zonnequin M, Vallet M, Delage L, Pohnert G, Leblanc C, Markov GV

Biochimie 239A: 93-102

Go to publication

Enhanced cell aggregation in the Chlamydomonas reinhardtii rbo1 mutant in response to multifactorial stress combination

Pascual LS, Mohanty D, Sinha R, Nguyen TT, Rowland L, Lyo Z, Mooney BP, Gómez-Cadenas A, Fritschi FB, Zandalinas SI, Mitler R

Plant Physiology 199: kiaf551

Go to publication

Cysteine signalling in plant pathogen response

Moormann J, Heinemann B, Angermann C, Koprivova A, Armbruster U, Kopriva S, Hildebrandt TM

Plant, Cell & Environment 48: 7107-7122

Go to publication

HEXAGON-IMAGING-PAM

Design
Closed housing, aluminum frame
Working Distance
20 cm
Light sources

Blue Excitation Light Source: 451 nm dominant wavelength (ML, AL and SP) 6 x 13 Cree high power LEDs

Far Red light Source: 730 nm peak wavelength

Light Field
Vertical incidence on sample; LED distribution optimized for uniformity; at standard working distance maximal deviation from mean intensity +/- 7 %; modulation frequency 1-8 Hz; max. actinic intensity 2100 μmol quanta m-2 s-1 PAR; maximum saturation pulse intensity 4100 μmol quanta m-2 s-1 PAR
Temperature Range

0 – 50°C

Design
Black and white c-mount camera operated in 11-bit-mode at 16 frames/sec
CMOS Chip
Sony IMX264 CMOS 3/4" featuring 2x2 pixel binning (1200 x 1000 px final resolution)
Interface
GigE-Vision®
Lens Mount

C-mount

Dimensions
8,64 cm x 4,4 cm x 2,9 cm (L x W x H) (without lens)
Weight
< 200g camera only
Temperature Range
0 – 50°C (non-condensing)
Design
F1.4/8 mm 2 MP prime lens (Ricoh), as bundle together with spacer ring and appropriate PS II filter set
Dimensions
42.0 mm x 36.7 mm
Lens Mount

C-mount

Filter Screw Size
40.5 mm
Iris Range
1.4 - 16
Weight
76 g (lens only)
Temperature Range
-20 – 50°C (non-condensing)
Product
Microprocessor controlled switching power supply with ripple 20 mVpp
Input
90 to 264 V AC, 50/60 Hz
Output Watt
640 W
Output Current
(max.): 20 A
Output Voltage
(max.): 80 V/DC (locked at 48 V)
Dimensions
395 mm x 92 mm x 240 mm (L x W x H)
Weight
7 kg
Temperature Range
0 – 50°C (non-condensing)
Operating System

PC-software ImagingWinGigE for Win 11

Data Output Format

xpim, csv, jpg, tif (raw image format is b/w in 11-bit color depth, 1200 x 1000)

Availability
License-free download from Walz homepage, regularly updated
Minimum PC requirements

Intel core i5 or comparable CPU, min 8 GB free RAM, built-in Gigabit Ethernet (GigE), Win11 OS

Features

Data display and evaluation plus instrument settings on 7 different windows

Product
Mini-PC with NUC 11 Pro Board NUC11TNBv5
Operating System
Win 10 Pro
CPU
Intel core i5 1135G7 (vPro with TPM 2.0)
RAM
8 GB
Connectivity
Intel® i225-LM 2500 Mbps RJ45 Ethernet; 2x Thunderbolt (DP 1.4a and USB 4), Wi-Fi 6
Power supply

120 W AC adapter

Storage
512 GB NVMe PCIe M.2 SSD
Dimensions
117 mm x 112 mm x 54 mm (L x W x H)
Weight
652 g (including mounting angle)
Temperature Range
0 – 40°C (non-condensing)
Design
Aluminum frame with potholder tray inserts, taking up 7 cm round flowerpots or 7 cm injection molded pots. Mounted on the rear wall of the housing
Working Distance
20 cm below normal bottom plate (can stay in place when bottom plate is used)
Weight
960 g (without the potholder tray inserts)
Dimensions
46 cm x 40 cm x 10 cm (L x W x H)
Design of sensor

Mini quantum sensor for selective PAR (photosynthetically active radiation) measurement, cosine corrected for PPFD (photosynthetical photon flux density) measurement.

Sensor housing

Black anodized aluminum housing

Diffuser material

Perspex

Signal detection

High stability silicone photovoltaic detector with filter set for PAR correction (to learn more about the typical sensitivity see “General Features”). Signal output typically -2 μA / (1000 μmol m-2 s-1)

Temperature coefficient of photodiode

0.01 %/K

Absolute calibration

± 5 %

Angular dependence

error < 4 % between angles from -80° to +80° from normal axis

Immersion coefficient

Typically 1.32

Operating temperature

- 5 °C … + 45 °C

Cable length

3 m

Connector

BNC

Power supply

Not required

Size

Height: 16 mm
Diameter: 14 mm
Diffuser diameter: 5.5 mm

Weight

32 g

Design

Aluminum box with individual foam lining for HEXAGON-IMAGING-PAM and accessories

Dimensions

 62 cm x 62 cm x 62 cm (L x W x H)

Weight

6 kg

Design of sensor

Small versatile waterproof mini quantum sensor for selective PAR measurement, cosine corrected for light incident at an angle between -30 ° to +30 ° from surface normal for PPFD (photosynthetical photon flux density) measurement, with base plate for screw connection.

Sensor housing

Black resin material

Diffuser material

Perspex

Signal detection

High stability silicone photovoltaic detector with filter set for PAR correction (see “General Features” for typical response)

Signal output
Typically 10 μA / (1000 μmol m-2 s-1)
Temperature coefficient of photodiode

0.01 %/K

Absolute calibration
± 10 %
Immersion coefficient
Typically 1.15
Angular dependence
Error < 3 % for angle between -30 ° and +30 ° from normal axis (see chart for typical response)
Design of sensor
Microscopy quantum sensor for PPFD (photosynthetical photon flux density) measurement.
Operating temperature
- 5 °C … + 45 °C
Cable length
3 m
Connector

BNC

Size

Base plate: 12 mm x 7 mm x 1 mm (H x W x L)
Sensor housing 5 mm x 7.5 mm x 7 mm (H x W x L)
Diffuser diameter: 3 mm

Weight

26 g

Accessories

Design

Light grey plastic housing with connectors, membrane keyboard and a white illuminated LCD graphic display

Dimensions

12 x 7.5 x 3.5 cm

Weight

210 g (including 4 AAA 1.5 V batteries)

Power supply

4 AAA-type batteries or 5 V DC from USB voltage source when connected to the computer

Working conditions

up to 85 % rH (avoid condensation), - 20° to + 50°C ambient temperature

Time resolution

PAR channel #1: 100 samples / second, PAR channel #2 and other channels: 5 samples / second (connected to computer running WinControl-3 software)

Operation time

10 days or ca. 100 days automated logging with sleep mode (1 meas. / 5 min). Unlimited working time via USB connection (PC-software WinControl-3 – no sleep mode)

Inputs
  • Two BNC-connectors for the connection of two PAR-sensors with individual calibration factors between -50.0 and -9999.9 (memory for 10 calibration factors), range switchable in 5 steps 250 nA to 0.6 mA
  • Connector for Monitoring Leaf-Clip JUNIOR-B; an adapter is available for the connection of the Leaf-Clip Holder 2030-B, and the Micro Quantum/Temp.-Sensor 2060-M
  • Connector for additional digital sensors (still under development)
  • USB-Connector for connection with computer (software: WinControl-3)
Memory

Flash memory used as ring buffer for 50000 lines (1 line / single measurement)

Display

White illuminated graphic display with 5 different display modes (1: all data; 2-4: two selected sensors in big letters; 5: chart mode for channel no. 1, with maximum, minimum and average indicated), resolution: 0.1 μmol m-2 s-1

Computer Connection

1 free USB socket. Processor, 1 GHz. RAM, 256 MB. Hard disc space, 20 MB. Screen resolution: 800 x 600 pixels. Interface, USB 1.1, 2.0 and 3.0. Operating system: Microsoft Windows 10 and 11.

ImagingWinGigE Software for HEXAGON-IMAGING-PAM

General Features and Graphical User Interface

The HEXAGON-IMAGING-PAM is fully controlled by the dedicated ImagingWinGigE software.
When started, the ImagingWinGigE software opens with the image window that occupies most of the user surface showing the Ft value as starting parameter. In the image window up to 100 areas of interest (AOIs) can be placed and the user can switch between parameters that shall be shown.

Values are represented in a false color scale ranging from black (0.0) to white (1.0) with red, orange yellow, blue and violet to purple in between. At first a central standard AOI is already present after the start of the software. Different shapes can be defined and the ImagingWinGigE software also offers a sample recognition function. AOIs' positions can be moved by the new Edit function.
Additional tabs are available for further settings and pre-programmed runs or the report tables. While working in these tabs, the image window is disengaged and is always present next to the normal ImagingWin window for a better overview. We have tried to structure the user interface in a practical way and have adopted many of the proven controls from the ImagingWin of the M-series units.

The customer can choose between 18 different parameters (Ft, Fo, Fm, F, Fm’, Fv/Fm, Y(II), Y(NPQ), Y(NO), PS/50, Abs, Red, NIR, NPQ/4, qN, qP, qL, Inh.) that can be displayed in the image window in different color modes. In this tab the alteration of the parameters can be observed in real-time during the experiment. The kinetics window shows various parameter values for some or all AOIs of the currently chosen experiment plotted versus time. It serves for the evaluation of dynamic dark / light phenomena (Kautsky curve or Induction curve).

Some of the possible experiments are already preset in the Kinetics or the Light Curve tab so that also the beginner finds an easy starting point for his first successful experiments. For advanced users it is also possible to program script files with more complex structure and even remote control the device by using the software interface.

Easy light calibration using the ULM-500 Light Meter & Logger.
ImagingWinGigE in communication with the ULM-500 provides an automated light calibration routine to generate a calibrated internal light list and furthermore offers to follow an external illumination (an appropriate PAR sensor like the Walz LS-C is necessary).

Some new features can be provided solely for the ImagingWinGigE software for HEXAGON-IMAGING-PAM, not for the ImagingWin software suitable for GigE devices or the older FireWire camera versions of the IMAGING-PAM M-Series.