Screenshot of the NIR-measuring Light window following balancing of the four wavelength pairs and import of the differential model spectra (DMPs) of the orchid Phalaenopsis.
Screenshot of the Trig. Run window, showing a measurement consisting of three events: actinic light (AL, red) between 3 and 6 s, far-red light (FR, pink) between 10 and 20 s and multiple turnover pulses (MT, orange) at 3.8 and 20 s. Triggered Runs belong to the building blocks of script files.
Screenshot of the Fitting window, showing an experiment with a Phalaenopsis leaf to determine the Fd-DMP (pulse of light followed by dark period) in the left panel. The four traces (sea green, green, yellow and orange) represent the measurements of the four wavelength pairs. The purple lines give the interval used for analysis and where only Fd-re-oxidation is expected to occur. A comparison between the DMP of this leaf and that of a Hedera helix leaf is shown in the right bottom window.
Screenshot of the Fitting window. Experiment with a Phalaenopsis leaf used to determine the P700-DMP (light adaptation leaf, FR-light, 1 ms MT with FR background light) shown in the left panel. The four traces (sea green, green, yellow and orange) represent the measurements of the four wavelength pairs. The purple lines give the interval used for analysis and where only P700-redox changes are expected to occur.
Screenshot of the Slow Kinetics window showing the experiment with a Phalaenopsis leaf to determine the PC-DMP (light adaptation, FR light, Saturating flash followed by a period of darkness). The signals were deconvoluted on the basis of the DMPs of Hedera helix included in the software. The experiment shows clearly that beyond 9 s only changes in the PC redox state occur under these conditions. A script defining the experiment shows up as a pop-up window and was here shifted on top of the Slow Kinetics window.
Screenshot of the Report window. The screenshot shows part of the data from a Light Curve experiment saved in a record file.
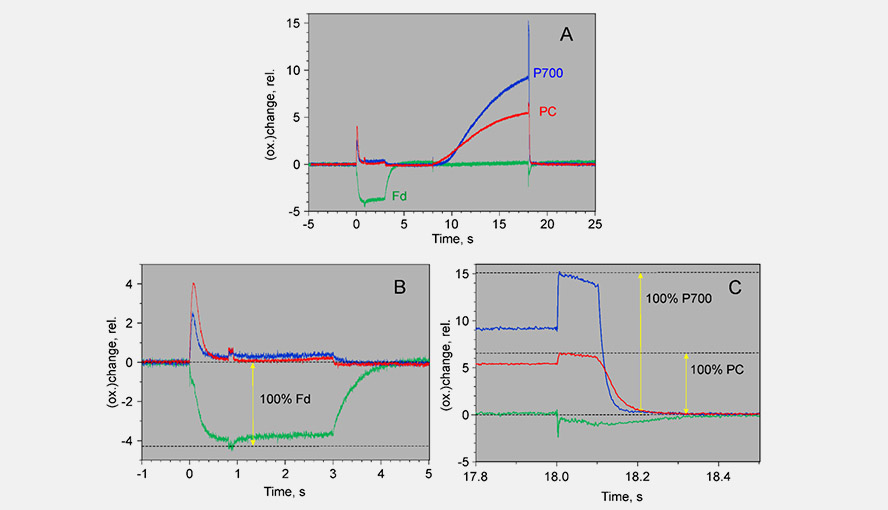
Screenshot of the Slow Kinetics window: An induction (actinic light: 119 µmol photons m-2 s-1) + recovery experiment (pink: Chl fluorescence; red: PC; blue: P700; green: Fd), measured on a Phalaenopsis leaf.
Screenshot of the Light Curve window, with an example of a Light Curve measurement on a Phalaenopsis leaf using 30 s steps. Only the parameters Y(I), ETR(I), Y(II) and ETR(II) are shown. The list on the right hand side of the graph shows all the parameters that can be plotted. The ETR data were fitted with the Eilers and Peeters (1988) model.
Screenshot of the SP-Analysis window. Several PS I and PS II parameters of the Light Curve experiment are shown as a function of time (each point represents a light intensity). Beyond point 6 (82 µmol photons m-2 s-1) a new phase sets in with PS I becoming more and more oxidized, PS II becoming more reduced and a new phase in NPQ induction.
Screenshot of the Yield Plot window: the effective quantum yield of photosystem I (Y(I)) is plotted as a function of the effective quantum yield of photosystem II (Y(II)). Data are taken from the Light Curve experiment shown in an earlier figure. Between ~100 and 830 (the highest intensity measured) µmol photons m-2 s-1 the relationship between the two parameters is approximately linear.