MICRO-PAM
Version:
Compact Fluorometer for Long-term Monitoring of Photosynthesis
Amber Version - MICRO-PAM
AMBER Version
Measuring Heads MICRO‑HEAD/3B and MICRO‑HEAD/3A
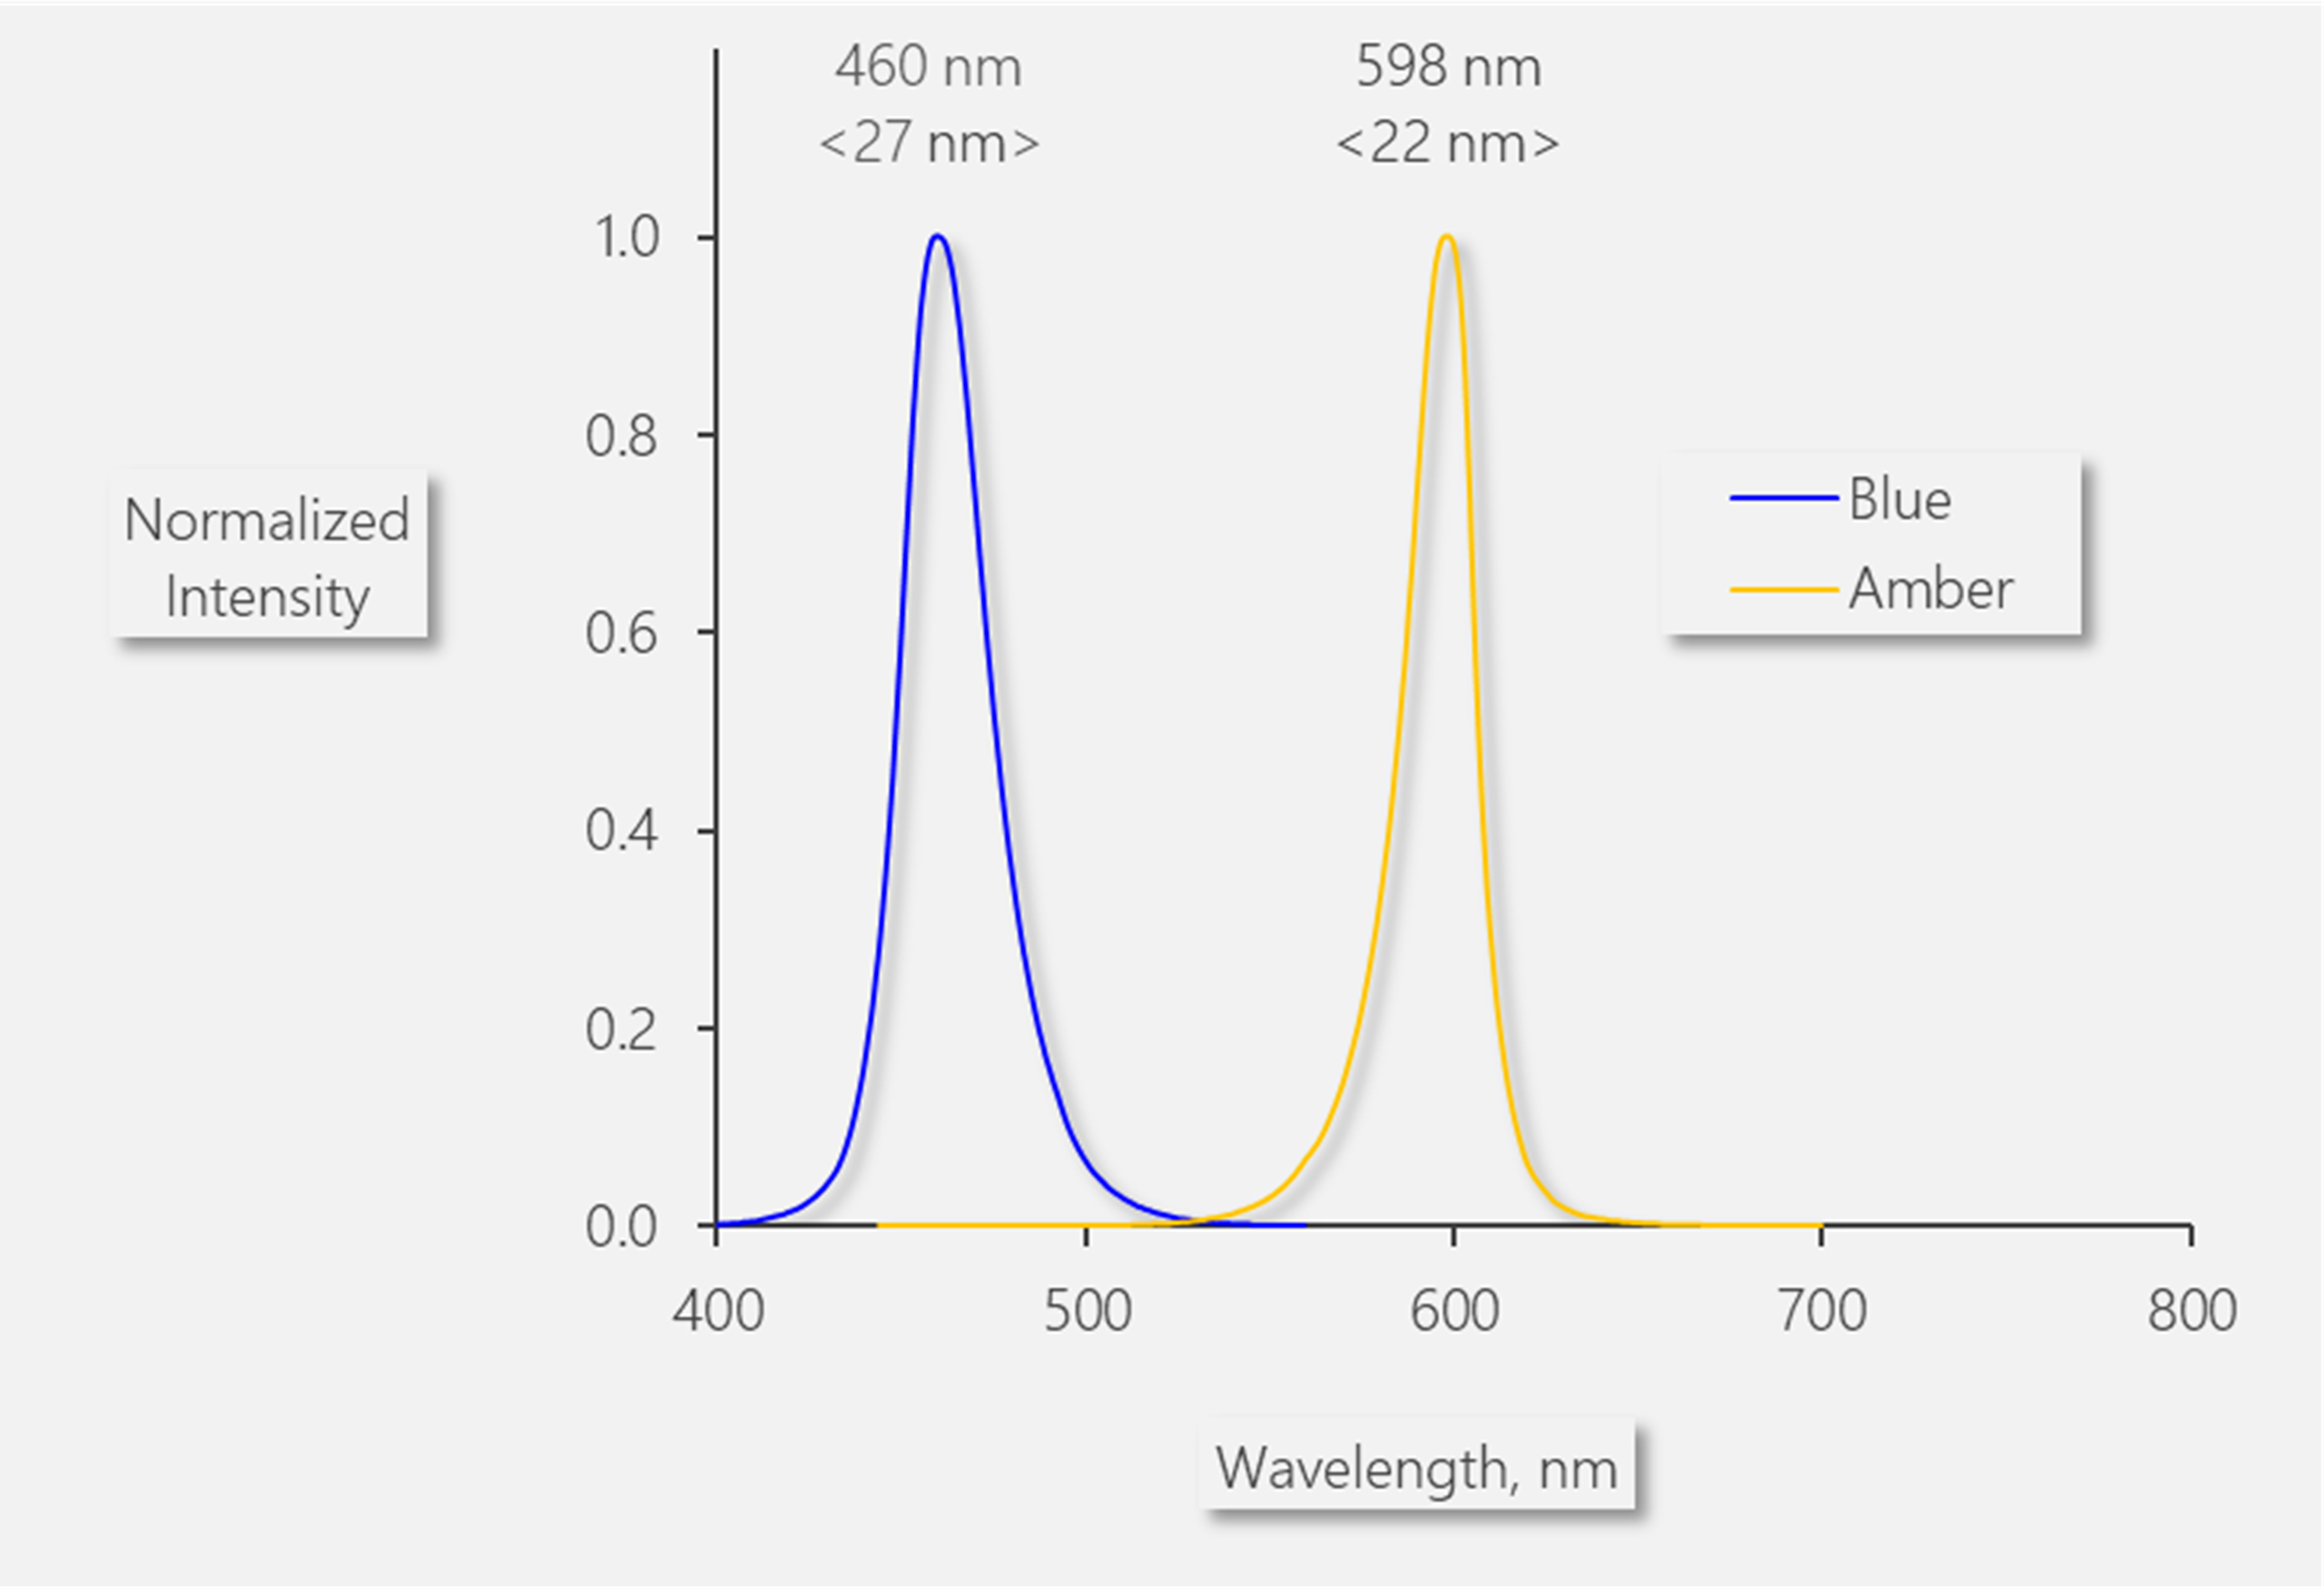
MICRO-PAM systems can be configured with measuring heads MICRO-HEAD/3B and MICRO-HEAD/3A. The measuring head MICRO-HEAD/3B probes photosynthesis with blue light which has a peak intensity at 460 nm and full width at half maximum of 27 nm (Fig. 1). MICRO-PAM and MONI-PAM systems employing blue light have successively proven itself in terrestrial and aquatic research.
The measuring head MICRO-HEAD/3A possesses an amber LED with emission peaking at 598 nm and a full width at half maximum of 22 nm (Fig. 1). Amber light is better absorbed by cyanobacteria than blue light. Correspondingly, the quality of the PAM signal excited by amber light is superior to that excited by blue light. For this reason, MICRO-PAM systems configured with measuring heads MICRO-HEAD/3A are particularly suited to probe cyanobacterial mats and lichens, or crusts containing cyanobacteria.
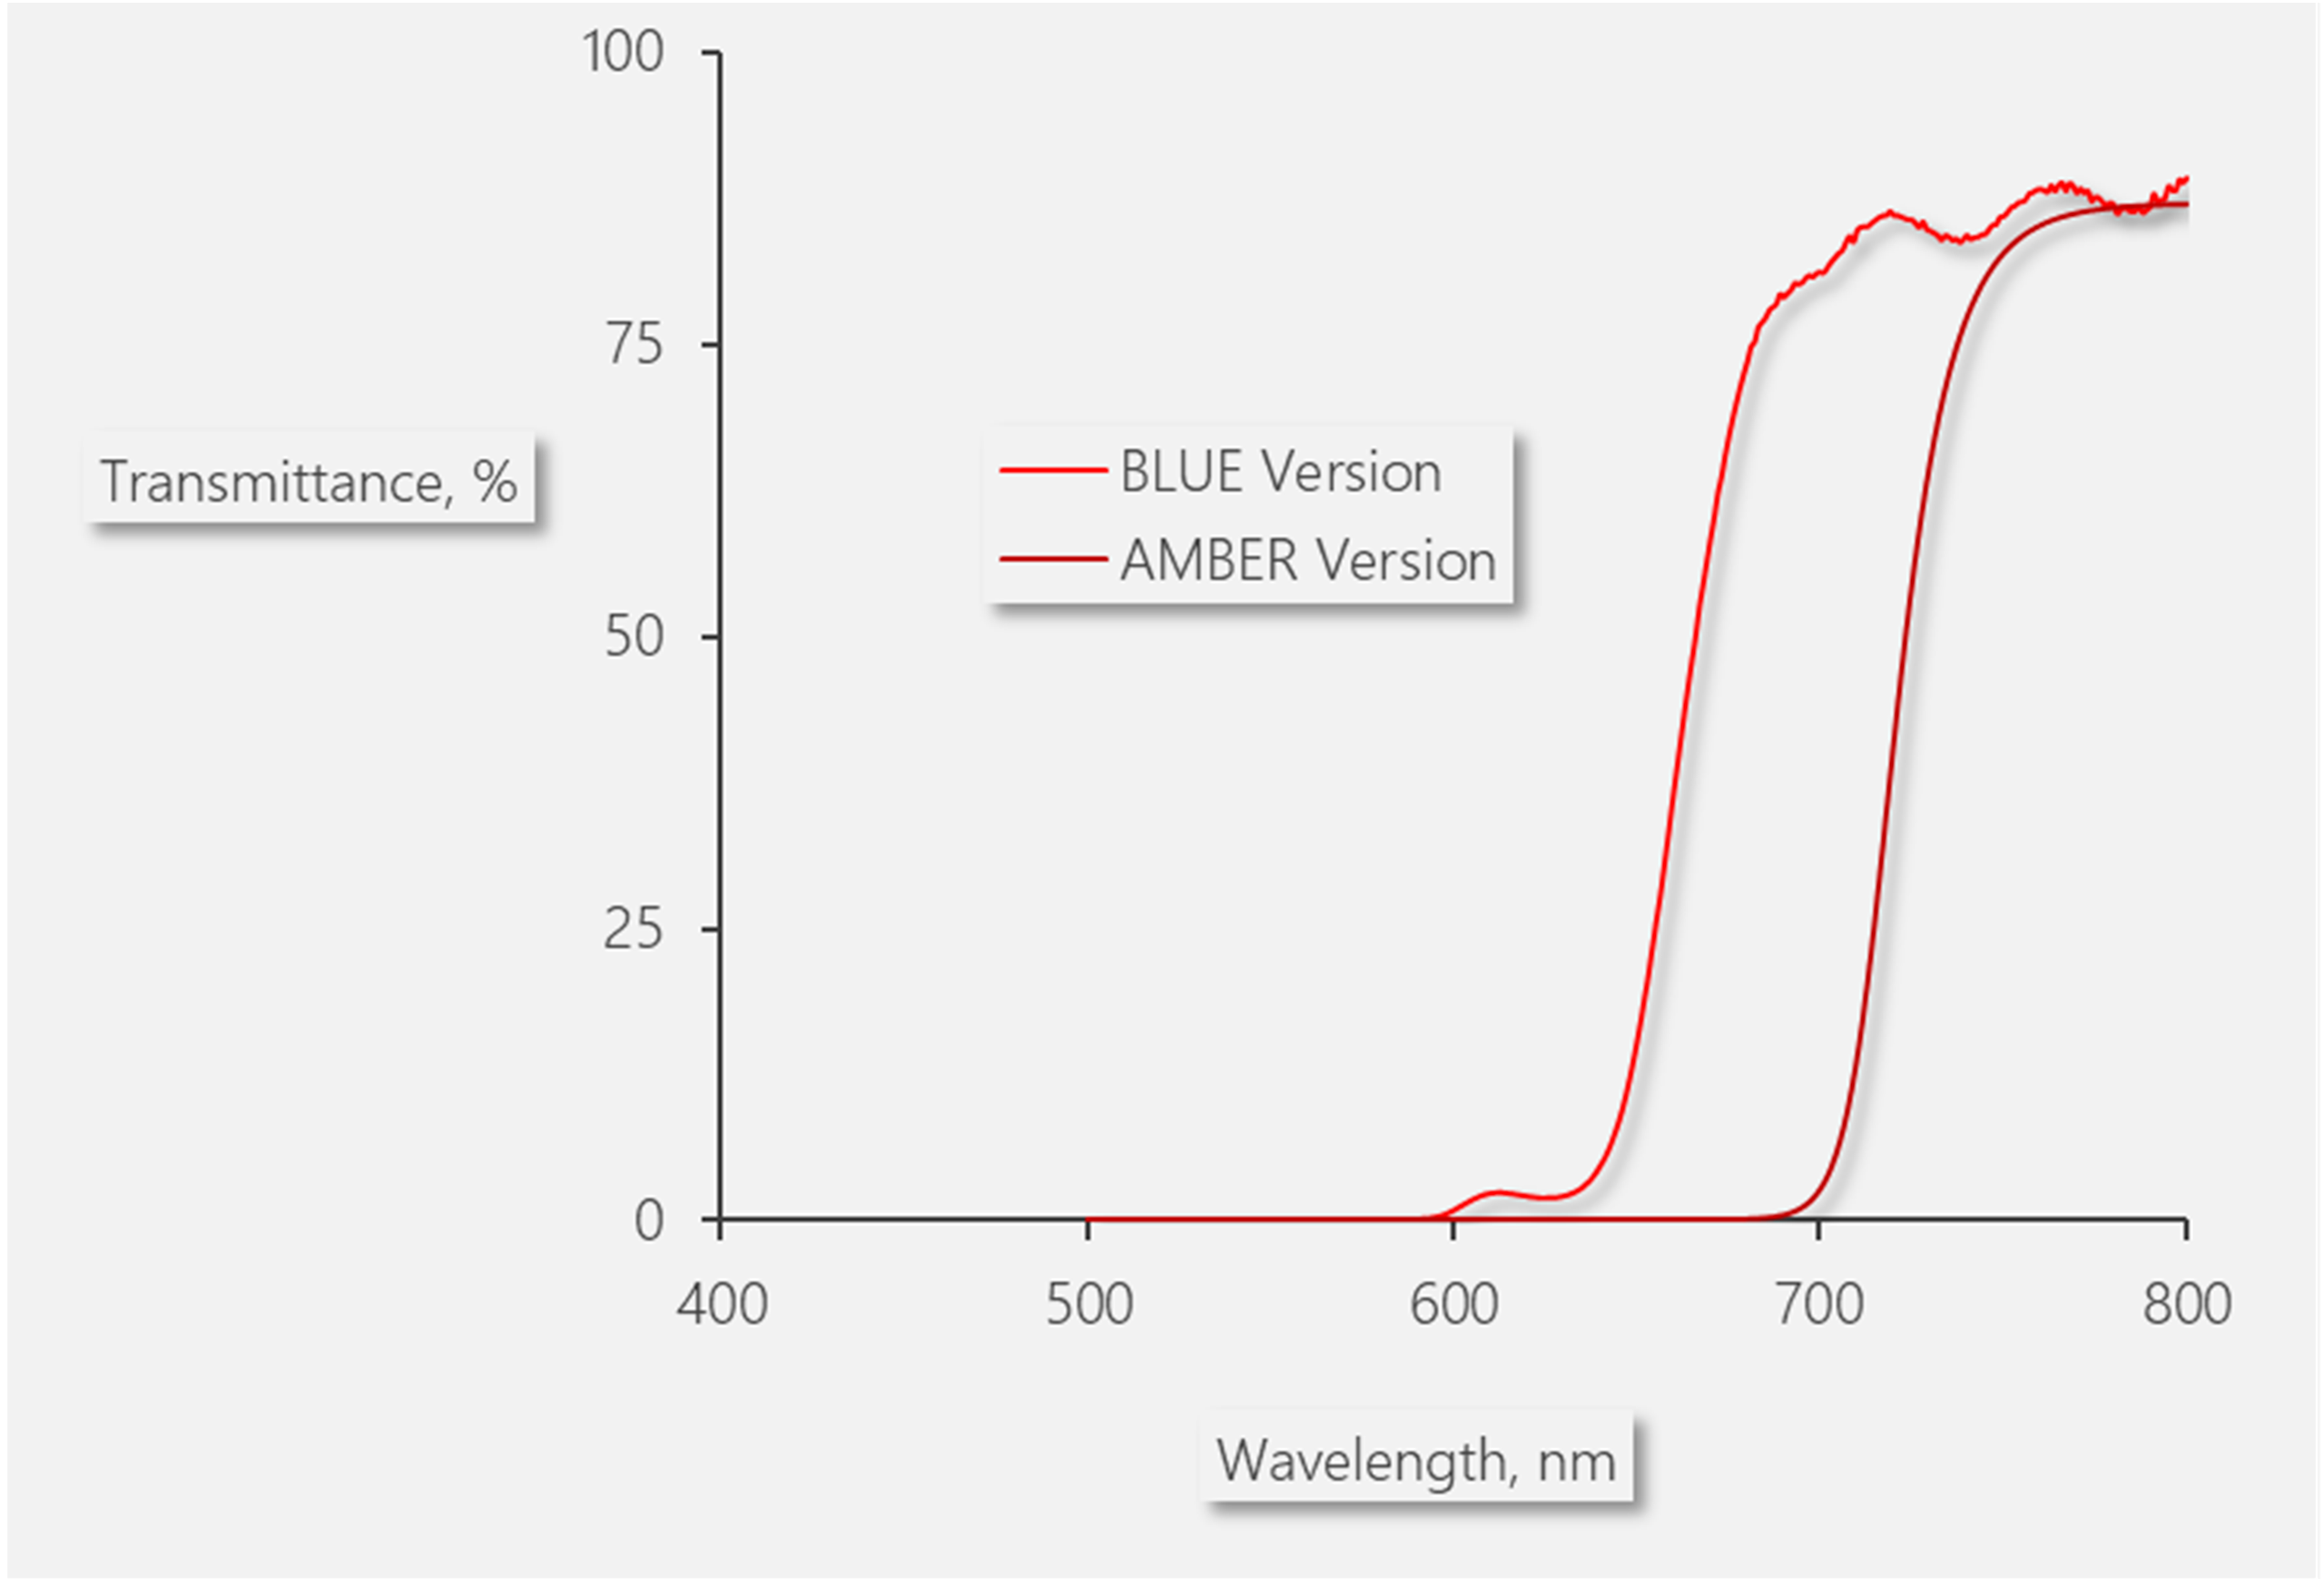
BLUE and AMBER Versions are further distinguished by the spectral window for fluorescence detection. The BLUE version detects fluorescence at wavelengths > 600 nm, whereas the AMBER version detects fluorescence at wavelengths > 700 nm (Fig. 2).
Cold-acclimation of Leaves
A MICRO-PAM system was used to monitor acclimation of photosystem II to decreasing temperature in fall. Outdoor experiments were performed with leaves from holly (Ilex aquifolium) from October 9 to November 6, 2019. Position: latitude: 49.656564 | longitude: 11.09793.
During the monitoring period, the maximum FM’ showed a tendency to decrease and exhibited lowest values between days 20 and 24 (Fig. 1). On average, the PAR was higher at the initial part of the experiment compared to the final part, but a decrease comparable to the FM’ was not observed (Fig. 2).
Temperature showed a tendency to decrease. As observed for FM’, minimum values were recorded between das 20 and 24 (Fig. 3).
Analyzing the relationship between maximum FM’ and minimum temperatures by linear regression yielded a coefficient of determination of 0.6 (Fig. 4), suggesting that the two parameters are related to each other. Sustained non-photochemical quenching might be a factor involved in this fluorescence/temperature relationship.


Lichen Photosynthesis (MICRO-PAM Prototype)
Prototypes of the measuring heads MICRO-HEAD/3B have been successfully employed to monitor photosynthesis of lichens growing under extreme climate conditions. Experimental sites include Tierra del Fuego and the Antarctica.
The poster below describes the experimental setup and shows long-term data of PAR, temperature, photosystem II yield and calculated electron transport rate.


Scientific Publications using Walz Devices
Source: Google Scholar.
Keywords: (Walz OR Waltz) Effeltrich.
Date: June 22, 2026.
Ʃ = 19642
Source: Google Scholar.
Keywords: (Walz OR Waltz) Effeltrich.
Date: June 22, 2026.
Ʃ = 19642
Selected Publications
The ECOSENSE forest-enriching tower-based flux measurements of carbon and water exchange with novel distribute sensor networks
ARPHA Conference Abstracts 8: e149267
Evaluation of comprehensive alkali resistance in tomato germplasm seedlings
Euphytica 221: 137
A novel multilayer cultivation strategy improves light utilization and fruit quality in plant factories for tomato production
bioRxiv-4
Field integration of shoot gas-exchange and leaf chlorophyll fluorescence measurements to study the long-term regulation of photosynthesis in situ
Tree Physiology 45: tpae162
Harnessing LED technology for consistent and nutritious production of large-fruited tomatoes
HortScience 60: 1851-1859
Modulation of phenology and agronomical performance of Syrah grafted on rootstocks under combined salinity and water stress conditions: a three-year field study
Plant Stress 18: 101050
Novel methods facilitating the mechanistic interpretation of multiscale optical remote sensing measurements.
Dissertationes Forestales 349
Sinusoidal LED light recipes can improve rocket edible biomass and reduce electricity costs in indoor growth environments.
Frontiers in Plant Science 15: 1447368
Effects of exogenous melatonin on Chrysanthemum physiological characteristics and photosynthesis under drought stress.
Horticulturae 9: 106
Performance of singular spectrum analysis in separating seasonal and fast physiological dynamics of solar-induced chlorophyll fluorescence and PRI optical signals.
Journal of Geophysical Research: Biogeosciences 126: e2020JG006158
Characterization of river biofilm responses to the exposure with heavy metals using a novel micro fluorometer biosensor.
Aquatic Toxicology 231: 105732
Metabolic activity duration can be effectively predicted from macroclimatic data for biological soil crust habitats across Europe.
Geoderma 306, 10-17
In situ monitoring of microclimate and metabolic activity in lichens from Antarctic extremes: a comparison between South Shetland Islands and the McMurdo Dry Valleys.
Polar Biology 39: 113-122
MICRO-PAM (Amber Version - MICRO-PAM)
5 mW in standby mode. Operating mode, depends on the number of MONI-PAM measuring heads connected (see MONI-HEAD/485 power consumption)
WinControl-3 System Control and Data Acquisition Program (Microsoft Windows 10/11) for operation of measuring system via PC, data acquisition and analysis. Not compatible with Windows 10 on ARM
100 m
100 m
Two monocrystalline silicon panels. Waterproof and dustproof in accordance with IP 67. Each equipped with 0.9 m cables for the plus and minus poles. Including 2 x 0.4 m adapter for connecting the 2 panels in parallel, a 5 m extension cord, and a 0.4 m adapter for connecting to the AUX or INPUT port of the Data Acquisition System MONI-DA
Vmax, 45.0 V, Imax, 1.14 A, Power 20 W
41.5 x 28.5 x 0.3 cm (L x W x H)
0.6 kg
Specification depend on available electronic components at the time of order
WinControl-3 System Control and Data Acquisition Program (Microsoft Windows 10 and 11) for operation of measuring system via PC, data acquisition and analysis. Not compatible with Windows 10 on ARM
Measured: Ft, F0, FM, F, F0’ (also calculated), FM’. Depending on the leaf clip connected, the software can record PAR, temperature and also humidity. [In the case of the MINI-PAM-II clip humidity can be measured, which the clip of the JUNIOR-PAM cannot.]
Calculated: F0’ (also measured), FV/FM and Y(II) (maximum and effective photochemical yield of PS II, respectively), qL, qP, qN, NPQ, Y(NPQ), Y(NO) and ETR (electron transport rate)
Two routines for determination of the cardinal points α, Ik and ETRmax of light curves
Automatic determination of signal offset for all light intensities and gain levels. Automatic calibration of internal PAR sensor against an external PAR sensor connected to the instrument
Processor: 0.8 GHz, RAM: 512 MB, screen resolution: 1024 x 600 pixels, interface: USB 2.0/3.0
USB
Aluminum box with custom foam packing MICRO-PAM
60 cm x 40 cm x 34 cm (L x W x H);
60 liter
4.9 kg
Accessories
See the MICRO-PAM in action
On June 10, 2026, after 7 years of recording photosynthesis of trees, a new experiment was started. Now, our monitoring station at the Walz headquarters streams live chlorophyll fluorescence data from ivy (Hedera helix). Five MICRO-PAM fluorometers continuously record photosynthetic yield, light intensity, temperature, and humidity - 24 hours a day, 7 days a week.
Three types of live graphs are available: Y(II) + PAR, Y(II) + ETR, and Temperature + PAR + Humidity. Data can be downloaded and displayed using the WinControl-3 software.
| Ch. | F | Fm' | Y(II) | PAR 1) | ETR 1) | Temp. °C | Air Hum. % |
|---|
ONLINE Configuration of MICRO-PAM
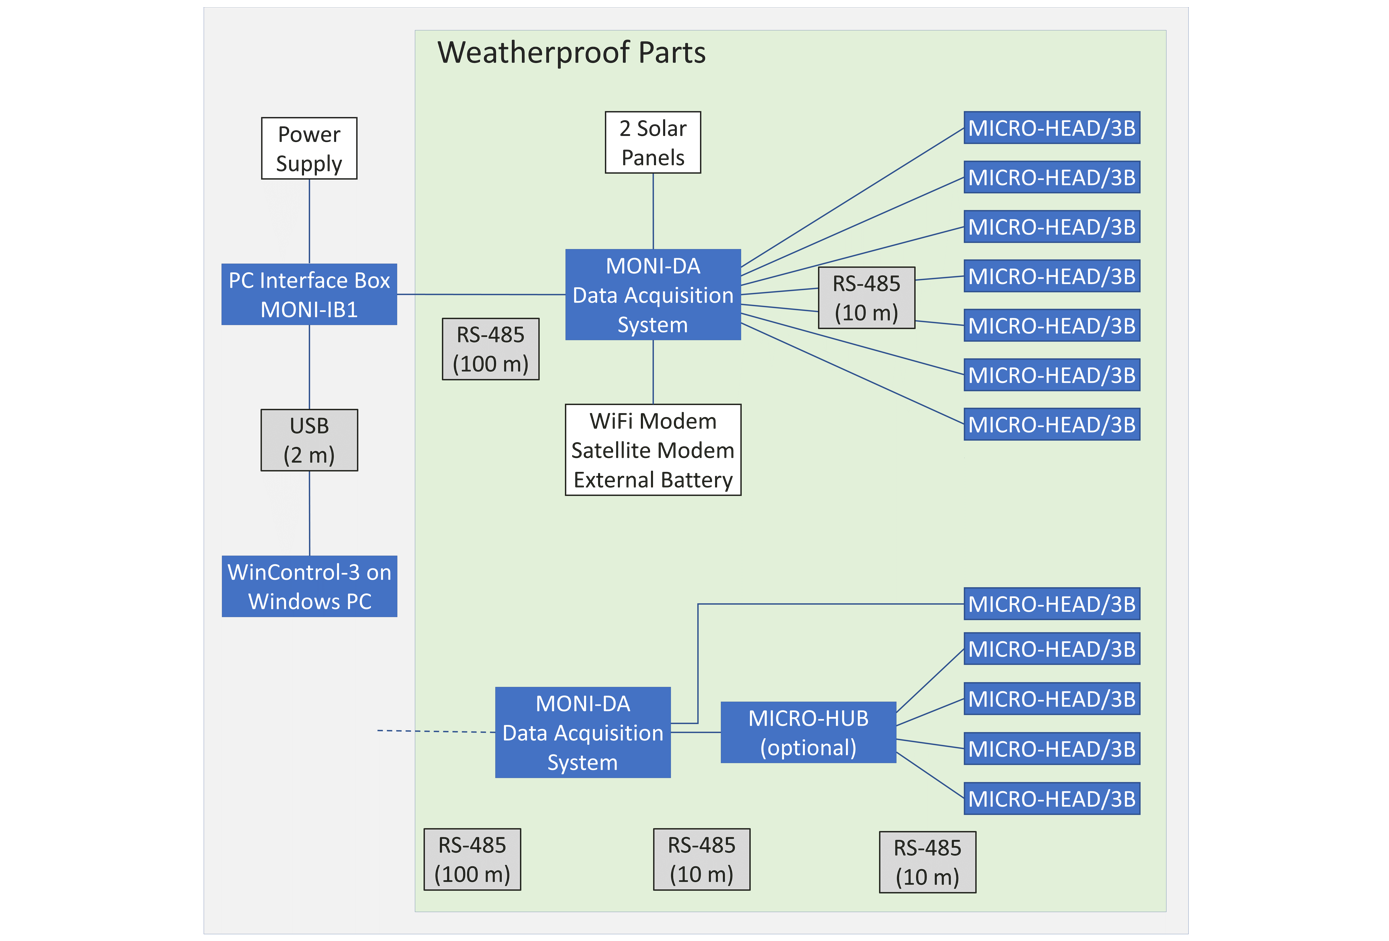
In the ONLINE configuration, the MICRO-PAM system is operated by the Software WinControl 3 running on a Windows computer. Up to 4 MICRO HEAD/3B can be connected to a computer USB port using the PC Interface Box MONI-IB4/LAN. The standard cable length between PC Interface Box MONI-IB4/LAN and MICRO HEAD/3B is 10 m.
The PC Interface Box MONI-IB4/LAN permits integration of the Online configuration into a local area network (LAN). The Ethernet port can be located at a distance of up to 100 m away from the MONI-IB4/LAN. For special applications, the interface box also offers RS 232 communication.


STAND-ALONE Configuration of MICRO-PAM
The STAND-ALONE configuration comprises the data acquisition system MONI-DA which permits battery-powered operation of the MICRO-PAM system. The STAND-ALONE configuration includes solar panels allowing data acquisition for very long periods of time independent of line power. An optional modem sends live data to a dedicated server for download by the user.
The Four-Way Distributor MICRO-HUB connects 4 measuring heads MICRO-HEAD/3B to a single port of the MONI-DA. The maximum number of measuring heads MICRO-HEAD/3B per MONI-DA is 16. As the MONI-DA has 7 input ports, the number of 16 is achieved using 3 MICRO-HUB interfaces each connecting 4 measuring heads to the MONI-DA, and linking directly another 4 measuring heads to the MONI-DA.




WinControl-3 Software for MICRO-PAM
General Features and Graphical User Interface
The WinControl-3 is a very versatile software dedicated to operate a certain class of Walz PAM fluorometers. The software executes classical experimental routines like fluorescence induction and light response curves, but also acquires and graphically display data.
WinControl-3 not only operates the MICRO-PAM but also the DIVING-PAM-II, JUNIOR-PAM, MINI-PAM-II, and MONITORING-PAM fluorometers, as well as PAM-CONTROL operated instruments (MICROSCOPY-PAM, MICROFIBER-PAM and WATER-PAM) and the Universal Light Meter ULM-500.


Data Evaluation
Saturating pulse analysis with automatic detection of fluorescence levels F0, FM, F, and FM’. Calculation of F0’ level fluorescence and of standard fluorescence parameters. Specifically, photochemical yield of photosystem II, FV/FM and Y(II), photochemical quenching, qP and qL, non-photochemical quenching, qN, NPQ, Y(NPQ), and Y(NO), and electron transport rate, ETR.
Advanced Features
All experimental protocols can be performed automatically using the batch file feature of WinControl-3. Convenient programming of experiments using the built-in macro recorder. The software is capable of DDE communication with peripheral machines.
Automated Routines
Repetitive triggering of fluorometer functions (e. g., dark-light induction and dark recovery curves) by adjustable clock. Automatic execution of light exposure protocols and fitting of two different model functions to data of light response experiments.
Data Export
Export of original fluorescence traces, saturating pulse analysis data and parameter estimates of light response curves as semicolon- or tab-separated data.
Usage
Highlights
- Ultra-compact measuring heads (96 g) for long-term photosynthesis monitoring
- Low power consumption for autonomous deployments
- Chlorophyll fluorescence plus environmental sensors - PAR, temperature, and humidity
Downloads
- Software: WinControl-3.41_Software
- Manuals & Documentation: MICRO-PAM/MONI-DA Manual
- Manuals & Documentation: LichenAtWork